

When input costs don’t move with commodity prices, margin protection requires surgical precision. Market research tells agribusinesses which buyer segments to prioritize and which to exit. Since 2020, U.S farm input costs have surged $100 billion cumulative. Yet commodity prices haven’t kept pace. This squeeze has forced agribusinesses past the old playbook to absorb costs, or cut across the board. Today’s margin leaders are using something sharper structured market research to identify which buyer segments actually generate profit after cost inflation is factored in.
- $490.3 Billion U.S farm production expenses in 2025, up 1.9% year over year and 7th highest on record when adjusted for inflation.
- 28% Total cost increase since 2020 $100B+ cumulative addition to farm input expenses.
- +21.5% to +4.7% 2025 cost trends livestock/poultry purchases up 21.5%, labor up 4.2%, interest up 4.7%; fertilizer and fuel relatively stable.
- 15–40% Real profitability spread across buyer segments under identical cost conditions, depending on farm size, crop type, and input dependency.
Key takeaways:
- Cost inflation hits buyer segments unevenly. Small operations and specialty crops face compressed margins faster than large commodity operators.
- Segmentation by profitability, not just size or location, reveals which buyers warrant premium service and which are cost sensitive.
- Agribusinesses using structured market research to target selectively are defending 10–20% margins, those attempting across the board cost absorption are margin compressed.
What’s Driving the Margin Squeeze in 2025
U.S. farm production expenses are forecast to grow 1.9% in 2025 to $490.3 billion. But which costs are rising and which buyer types feel the pain most? inputs and production expenditures forecast Labor +4.2%, livestock/poultry purchases +21.5%, and custom farm services are climbing. Fertilizer costs once the primary margin killers are stabilizing. The result is non uniform cost pressure.
A large commodity corn operation with high mechanization but lower labor intensity faces different margin dynamics than a 500 acre dairy or specialty produce operation where feed and labor represent 60% or more of input costs. Agribusinesses selling into mixed buyer bases cannot use one cost recovery strategy across all segments.
Consider what this means operationally. A ranch running 2,000 head of cattle absorbs labor cost increases across high volume and commodity beef margins of 8-10%. That same operation cannot pass costs downstream because commodity beef pricing is set at the CME. A 200head specialty grass fed producer, by contrast, sells at a 40-50% premium and operates on 20-30% margins. They have room to absorb a 15-20% labor cost spike and still remain profitable. Their buyer, often a premium restaurant or DTC channel, expects and accepts price increases tied to transparent cost documentation. Same input. Radically different margin mathematics.
The $100 Billion Question Since 2020, U.S. farm input costs have risen $100+ billion cumulative. Yet milk prices rose less than 2% year over year in 2023–2024, and corn/soybean pricing remains commodity-bound. Agribusinesses cannot pass all costs downstream. Where margin returns depend entirely on buyer selection and operational leverage.
This environment forces a choice, treat all buyers the same and compress margins uniformly, or use profitability data to identify which buyer segments to defend, which to consolidate, and which to exit. Margin leaders are doing the latter.
Why Cost Absorption Doesn’t Work The Buyer Segment Reality
The instinct to cut costs uniformly or raise prices uniformly fails because it treats all buyers as interchangeable. They are not A 10,000 acre corn operation operates on 8–12% margins and can absorb short term cost spikes through operational efficiency improvements. A 200 acre organic vegetable producer operates on 20–30% margins but has zero flexibility if feed, fuel, or labor costs rise. A livestock operation focused on commodity beef margins differently than one producing specialty or grass fed premium products.
If you treat them the same, you either leave money on the table with high margin buyers underpricing premium segments, lose low margin buyers to competitors price compression in commodity segments, or destroy profitability across segments uniformly high costs squeeze low margin operations.
Across implementations our research team has audited in agricultural supply chain infrastructure, a critical pattern emerges: agribusinesses that succeeded in 2023–2024 were not those that absorbed cost inflation wholesale, but those that used structured market research to identify and prioritize high margin buyer segments, then calibrated their product mix and pricing accordingly.
Buyer Profitability by Segment Pre and Post Inflation Margins
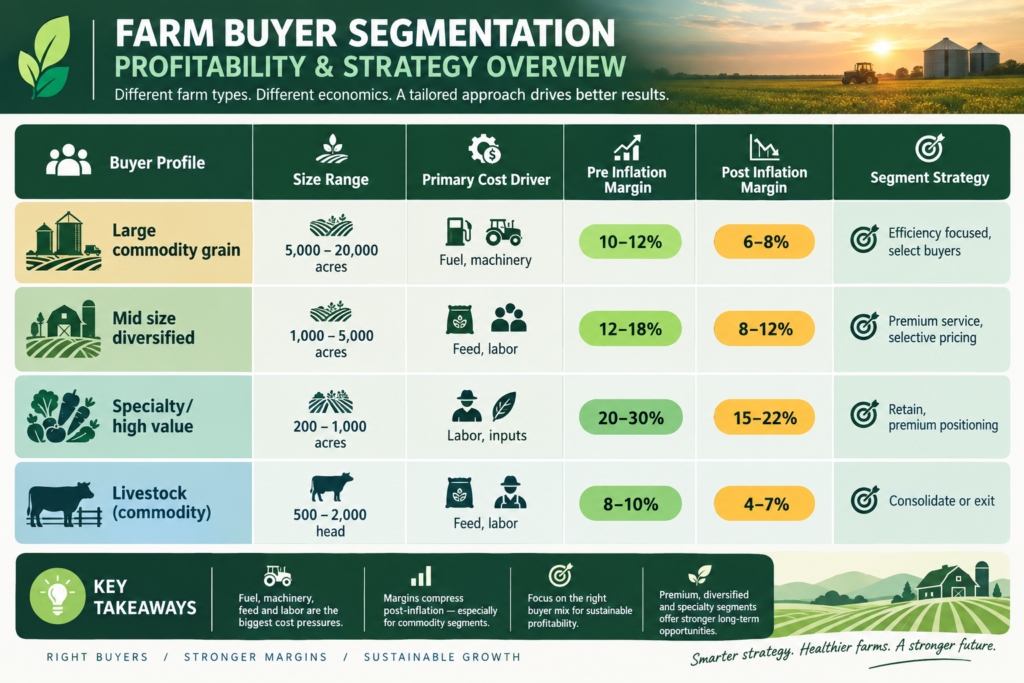
This is the insight that separates margin defenders from margin compressed operators. Cost data alone does not drive decision-making. Buyer profitability data does.
Building Your Buyer Segmentation Framework
Three data layers inform effective segmentation in a high cost environment.
Layer 1. Profitability Data by Buyer:
Start with historical margin by customer, or by customer type if individual data is unavailable. Calculate cost of goods sold plus operating costs by customer delivery, service calls, custom work, returns and adjustments. Most agribusinesses have revenue data nailed down. Profitability data by customers is where they stumble.
The calculation is simple, net profit per customer equals all revenue from that customer minus direct costs product, delivery, fulfillment, returns minus your allocated share of indirect costs staff time, facilities, overhead. Do the math. A customer running at 4% net margin is a cost center, not a profit center, regardless of loyalty or volume.
Layer 2. Buyer Characteristics That Correlate With Margin:
Once you rank by profitability, correlate the results with buyer characteristics, farm size, operation type commodity vs specialty, Agricultural brand pr commodity markets
crop type input intensive vs low input, loyalty and service intensity price shoppers vs service dependent, input dependency heavy feed/fertilizer users vs pasture based operations, and technology adoption.
The farm size assumption often fails. A 300 acre operation using precision agriculture tools and contracting custom services may be higher margin than a 5,000 acre commodity grain operation. The segmentation variable that matters most is the one that correlates strongest with profitability in your data. Don’t assume size matters.
Layer 3. Trend Signals What’s Changing in Your Buyer Base:
Cost absorption capacity, which segments have pricing power or offsetting revenue opportunities? Churn risk, which segments are most likely to switch to lower cost suppliers if you adjust pricing? Volume vs margin trade offs, which segments drive volume but destroy margin, and which are small volume and high margin?
WTO data shows global goods and services trade reached $34.65 trillion in 2025, rising 7% year over year, increasing competitive intensity and reinforcing the need for agribusinesses to benchmark prices, protect margins, and refine market positioning using pricing analysis. This pressure is real. The response is structural market research.
The Decision Rule, Buyers generating more than 15% margins after input cost inflation are retain and invest segments. Buyers at 8–10% margin are selective service segments. Buyers below 8% post inflation are consolidation or exit candidates. Customize this threshold for your operation, but use it consistently. Math beats intuition every time.
Pricing and Product Mix by Segment, Three Operator Scenarios
The following profiles illustrate how segmentation shapes pricing and service decisions in a cost volatile market.
Scenario 1. A Crop Input Dealer Fertilizer, Seed, Agronomy :
High margin segment, 2,000–5,000 acre operations with specialty or high value crops, strong service adoption, willing to pay for agronomic consultation. Strategy, premium pricing 5–8% above commodity buyers, bundled services soil testing, nutrient planning, seasonal consulting, annual contracts to lock retention. Margin impact, retains 20–25% margin despite cost inflation, regenerative agriculture branding certification.
Mid margin segment, large commodity grain operations 8,000+ acres, price sensitive, volume focused. Strategy, efficient service delivery digital ordering, batch delivery, minimal consulting, competitive pricing, volume discounts to consolidate relationships. Margin impact, maintains 10–12% margin through operational efficiency.
Low margin segment, small operations under 500 acres, sporadic buying, high service intensity per dollar. Strategy, exit via attrition or formal consolidation offer transition period, refer to regional competitors. Margin impact frees capacity to serve high and mid margin segments, improves overall profitability despite volume decline.
Scenario 2. A Livestock Feed Manufacturer :
High margin segment, premium or specialty operations grass fed, organic, niche breeds, willing to pay for customized formulations, consistent ordering. Strategy, custom feed development, premium pricing, technical support on herd health and nutrition. Margin impact: 18–22% margins sustainable.
Mid margin segment,conventional operations 500–2,000 head, commodity focused, bulk buying. Strategy, standardized formulations, volume pricing, digital ordering and logistics efficiency. Margin impact, 10–12% margins through scale efficiency.
Low margin segment, smallest operations under 200 head, infrequent buying, no loyalty. Strategy, move to partner or reseller model or exit, refer to larger feeders or co-ops. Margin impact,consolidate customers; redirect resources to high margin segments.
Scenario 3. A Produce Distribution or Cooperative :
High margin segment, premium retail or food service buyers, quality focused, consistent volume, willing to pay for local or certified or specialty claims. Strategy, differentiated positioning organic, sustainability certifications, local sourcing, premium pricing, dedicated account management. Margin impact, 18–25% sustainable.
Mid margin segment, regional wholesale buyers, some differentiation, price competitive. Strategy, moderate differentiation, selective service, volume pricing, seasonal contracts. Margin impact, 12–15% margins.
Low margin segment, deep discount or commodity channel, price driven, minimal differentiation. Strategy, minimal service, consolidate volume or exit, refer to commodity brokers. Margin impact, free capacity for higher margin channels.
The pattern holds across all three. High margin buyers are willing to pay for service and are reachable through relationship driven selling. Mid margin buyers respond to efficiency and volume pricing. Low margin buyers drain resources and offer no path to profitability without transformative cost reduction in the segment itself.
The Retention Risk, Consolidating low margin relationships feels like leaving money on the table. It is not. A $500K customer at 3% margin contributes $15,000 to overhead. A $200K customer at 18% margin contributes $36,000. Exit the first; defend the second.
How to Identify and Consolidate Low Margin Relationships
Identifying low margin customers is a data exercise. Consolidating them requires communication discipline Identification Process, Calculate net profit per customer revenue minus all direct plus allocated indirect costs. Rank customers from highest to lowest margin. Set a floor e.g., less than 8% post inflation margin. Flag consolidation candidates any customer below threshold plus showing signs of low loyalty or high service intensity.
Consolidation Approach Non Destructive, Transparent communication beats silent margin compression every time. Meet with low margin customers and explain the cost environment frankly. Offer three options, streamlined service lower costs equal lower service batch delivery, digital ordering, self service, no consulting higher pricing cover cost inflation through selective increases, emphasize value add to justify it, or transition partnership help them find a lower cost provider position as partnership.
Timeline, 3–6 months to communicate and transition. Offer discount or credit during transition if possible. Why this works, operators respect transparency more than surprise price hikes or service cuts. Consolidation framed as partnership retains goodwill better than silent margin compression. Some customers, when presented with transparent options, choose to consolidate their purchases with you and increase volume, flipping from low margin to mid margin relationship.
Protecting Long Term Customer Relationships in a Cost Volatile Market
High margin relationships are worth defending proactively, especially during inflationary periods. Three tactics stand out.
- Annual or Semi Annual Profitability Reviews With Key Accounts. Share anonymized market cost trends affecting their operation. Discuss margin outlook for their crop or operation type. Ask, How can we help you protect the margin this year? This positions you as a partner in cost management, not a cost pass through.
- Proactive Product or Service Innovation Tied to Their Cost Pressures. If feed costs spike, propose customized lower cost formulations. If labor is the cost driver, offer labor saving services bulk delivery, preset ordering. If energy costs rise, suggest energy efficient inputs or practices. This approach builds trust and stickiness that pricing alone cannot match. Lock Selective Relationships With Contracts.
- Long term volume commitments 12–24 months allow you to forecast and lock input costs. Offer modest discounts for commitment, signal stability to the customer. Protects both parties from short term cost volatility and strengthens retention. Across our implementations, agribusinesses using this approach report retention rates 15-20 points higher in high margin segments, even when competitors offer lower prices. The reason, trust based relationship defense costs less than price competition. Farm brand storytelling. Decision Framework, Which Buyer Segments to Prioritize
Decision Framework, Which Buyer Segments to Prioritize
Step 1. Calculate Buyer Profitability Post Inflation :
Rank all active buyers by net profit margin. Set a baseline: 8% as the breakeven service level, 15% as invest and grow, 20%+ as premium and defend.
Step 2. Map Buyer Segments to Margin Tiers :
Identify which operation types commodity grain, specialty crops, livestock, etc. fall into each tier. Do small operations naturally cluster in low margin? Do large operations cluster in mid margin? Is there a high margin niche?
Step 3. Assess Capacity Constraints :
For each margin tier, estimate your operational costs to serve that segment delivery frequency, service intensity, fulfillment complexity. High margin plus high service cost segments may not be worth keeping unless you can reduce service intensity.
Step 4. Design Segment Specific Strategies :
Define pricing, service level, and communication approach for each tier. High margin equals premium service plus selective pricing. Mid margin equals efficient service plus volume pricing. Low margin equals streamlined service or transition.
Step 5. Execute Consolidation or Transition :
Prioritize 3–5 low margin customers for conversation. Offer transparent options, streamlined service, higher pricing, or transition partnership. Document decisions and track outcomes.
Step 6. Monitor and Adjust Quarterly :
Margin changes as input costs move. Revisit profitability data quarterly. Migrate customers between tiers as needed. Celebrate retention wins in high margin segments.
FAQS
How do I know if my customer is actually low margin?
Calculate net profit per customer, all revenue from that customer minus direct costs product, delivery, fulfillment, returns minus your allocated share of indirect costs staff time, facilities, overhead. If the number is below 8% of revenue, they are low-margin. The number is the truth, your gut feeling is not.
If I raise prices on low margin customers, won’t they leave?
Maybe. But if they are already low margin, losing them improves your overall profitability. Offer the option transparently: keep service streamlined equals lower your costs equals lower price. Or a bundle in premium service equals higher price. Some will stick, others will self select to exit. Both outcomes improve your margin.
Should I segment by farm size, crop type, or something else?
Start with profitability data. Once you rank by margin, correlate it with other factors, size, crop, tech adoption, loyalty. The factors that correlate strongest with high margin become your segmentation criteria. Do not assume size matters. It might be that high tech precision farmers have higher margin regardless of size.
How do I handle a high volume, low margin customer who has been with me for years?
Loyalty is real, but so is math. Meet with them, show them the cost reality transparently, and offer the same three options, streamlined service, higher pricing, or transition partnership. If they have been with you for years, they may surprise you and consolidate their purchases in exchange for streamlined service, turning the relationship profitable.
What if my entire customer base is low margin?
This signals a systemic issue. Either your cost structure is too high, you need operational efficiency improvements, or your pricing strategy has been too competitive. You need to both reduce costs through operational efficiency and adjust pricing selectively. Start with your highest margin 20% and defend them fiercely while you work on the 80%.
Conclusion
Input cost inflation is not temporary. The $100+ billion cumulative cost increase since 2020 has fundamentally altered the economics of farming and agribusiness supply chains. Operators and input suppliers who respond by spreading costs uniformly or cutting across the board will find themselves margin compressed and under constant pricing pressure.
The margin leaders operating in 2025 are using a different playbook: structured market research to identify which buyer segments generate real profit after inflation, and then operating a different business model for each segment. High margin buyers get premium service and pricing power. Mid margin buyers get efficiency and volume focus. Low margin buyers get consolidated or transitioned.
This is not ruthless. It is honest. It acknowledges that not all customers are created equal, that one size fits all cost recovery does not work in commodity bound markets, and that protecting margin requires knowing your numbers at the customer level. The data tells you what the market is willing to pay. Segmentation tells you which buyers to serve. Together, they tell you where your real profit is.
For more on how agribusinesses are adapting pricing strategies in volatile cost environments, On building operational efficiency in high input environments, And for farm level context on how input costs are reshaping buyer behavior, check out our overview of farm input costs, tariffs, and marketing margins. The market data is clear. Math is inevitable. The only question is whether you’ll run it before your margin runs out.
